


Newsletter Subscribe
Enter your email address below and subscribe to our newsletter


- May/June 2018 Executive Summary Public procurement – the engagement of non-government resources, involves the administration of $Billions engaging hundreds of contractors, thousands of jobs and is c

Is Alberta’s Public Procurement Broken? – May/June 2018
Executive Summary
Public procurement – the engagement of non-government resources, involves the administration of $Billions engaging hundreds of contractors, thousands of jobs and is central to every level of government. It is almost as core to the Alberta economy as the oil sands, and as such the frequent subject of auditor reports. The Alberta Council of Technologies Society (ABCtech) conducted an On-line survey in May 2018 to learn about the practice and objectives of public procurement in Alberta. The views of contractors and administrators – their expectations and levels of satisfaction, comments and recommendations, were solicited from among those in ABCtech’s directory of individuals sharing an interest in the impact of emerging technologies.
Sample profile. The sample includes few administrators (12%) and is comprised mainly of public procurement contractors: urban, small-business contractors that are moderately reliant on provincial contracts up to $100,000. They do not have full-time resources dedicated to public bidding. Most are familiar with information and management services and somewhat less with construction, education and research. Most are familiar with provincial and municipal procurement processes and trade agreements. A majority expect to increase their involvement in bidding on government contracts.
Public Procurement Practices. The most important features and with considerable gaps in what is expected vs received by contractors in the practice of public procurement are the features that have a direct impact on bidding – timeliness and bidding/evaluative criteria. Features of less importance are those that are viewed as the objectives of government and biasing the achievement of Value for Money – Incentives for social and economic development and innovation. Gaps are greatest among infrastructure contractors with an interest in Construction, Transportation, Engineering also Communications. The features and comments of contractors provide insight into differences among contractors. The current uncertainty in negotiation of trade agreements may by affecting the expectations of contractors indicating decreasing interest in public procurement – particularly among the Calgary Region’s small businesses contractors.
Public Procurement Objectives. Contractors and Administrators align in their disagreement with the objectives of public procurement. The Disaster Recovery objective is the only exception. Otherwise, Administrators rate highest government’s stated objectives of Innovation and Vision & Leadership, and Effectiveness. Contractors disagree, including a very low rating for the objective of Effectiveness: Government procurement and project management are well aligned. That is, deliverables are on-time, on-budget, and as specified. Otherwise, while rated higher than Contractors, Administrators support is weak for the other objectives – particularly Value for Money, that both rate lowest. Of concern must be the generally low ratings by both Administrators and Contractors for the prime objectives of public procurement: Value for Money, Transparency, and Overall. The low agreement and very high disagreement by Contractors with all objectives – other than Disaster Recovery, is consistent for most Contractor features with the possible exception of size. The poor rating for the objectives of Value for Money and Transparency is highest for larger organizations. The comments reviewed indicate that the prime issues are with waste not corruption or fraud.
Recommendations. The broad dissatisfaction and pointed gaps in public procurement practices are evident. Support is weak for the associated objectives. Respondent comments and recommendations reinforce the Report’s several recommendations:
Action is warranted. The economy is changing – the digital age and emerging technologies are accelerating change. Organizations must adapt; to be nimble and responsive is essential. Public services secured through contracting that are sub-standard and inefficient are unacceptably wasteful. Every $Billion of waste by the Government of Alberta, for example, equates to over $222 per citizen. The socialization of public services is NOT the answer, nor are policies of “Buy Alberta!” What is needed is what is already promised in policy: Transparency, Value for Money, and Effectiveness. Contractors agree, And using public procurement as a blunt instrument for social engineering is offensive and contrary to securing good products and services – preference is bias, creating discord and resentment. What is inferior shouldn’t get preference. What isn’t inferior, shouldn’t need preference.
Table of Contents Page
Executive Summary …………………………………………………………………………………………………………………………………………. 1
Table of Contents ..…………………………………………………………………………………………………………………………………………… 3
Introduction ………………………………………………………………………………………………………..……………..………………….………. 4
CONTRACTOR’S COMMENTS RE: THE OBJECTIVES …………….. 30
Conclusion …………………………………………………………………………………………………………………………………………………….40
Introduction
Billions of dollars are spent annually by various levels of government in the purchase of supplies and services in Alberta. The public expenditure represents both a significant economic opportunity and the risk of waste, fraud and corruption. Procurement policy is shaped by trade agreements and regulations governing fair trade. The practice itself is the by-product of a make-or-buy decision, and an assessment of whether competition in the private sector is adequate to govern costs and standards. Independent audit reports are employed to provide independent oversight.
The Alberta Council of Technologies Society exists to advance the commercialization of emerging technologies as a contributor to diversification of the province’s economy. Public procurement continues to be of interest to our 20,000 followers comprised of a diverse array of industry and public sector interests, innovators and regulators, taxpayers and policy influencers, contractors and administrators. Our interest in public procurement has recently increased.
Public procurement is being exposed to increased public scrutiny as associated issues converge:
The Council elected to conduct one of the first external, independent assessments of public procurement in Alberta. We were particularly interested in obtaining the perspective of contractors, given the interest expressed by governments in heightening innovation. In May we canvassed our followers soliciting the interest of contractors and procurement administrators. The On-line survey posed a series of questions about the practice and objectives of public procurement by the federal, provincial and municipal governments in Alberta. The survey’s objectives were several, to learn about:
We assumed that the interests of administrators and contractors would be reasonably aligned as they are the prime partners in the system. We incorporated two questions, the answers to which served as primary reference points for the study: 1. Value for money and 2. Transparency – free from waste, fraud and corruption.
The summary and discussion of results are organized into sections: A. Contractors – Their Profile and Interests, B. Assessing Pubic Procurement Practices, C. Assessing Public Procurement Objectives and D. Recommendations and the Conclusion. Note. The identity of respondents is confidential. However, the data is open for scrutiny should others be interested in conducting and sharing their analysis.
A. Contractors – Their Profile and Interests
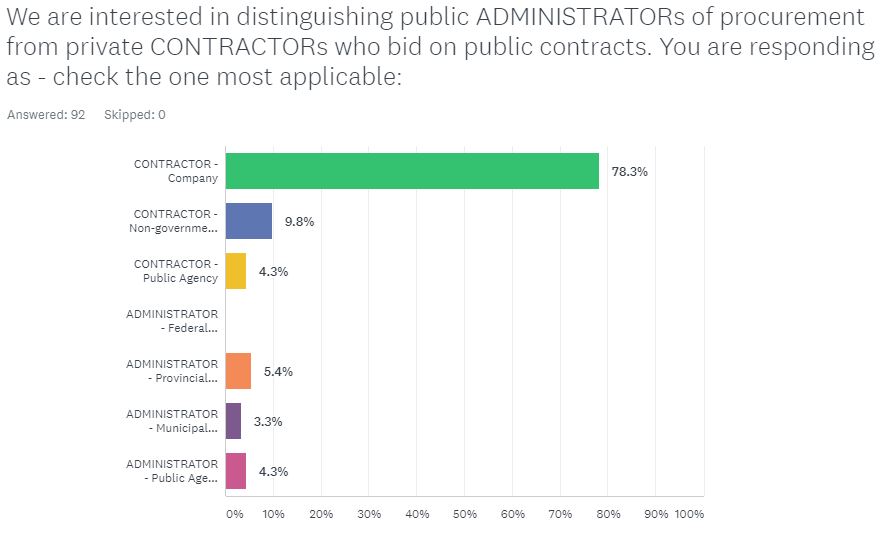
Of the 92 respondents, most (88%) were corporate contractors with a few (12%) administrators. Most of the contractors and administrators were from the Edmonton ( 72% and 64%) and Calgary (21% and 27%) Regions with few from outside urban Alberta (7% and 9%).

Contractors N = 81
Northern Alberta 2%
Edmonton Region 72%
Central Alberta 5%
Calgary Region 21%
Southern Alberta 0%
Administrators N = 11
Northern Alberta 0%
Edmonton Region 64%
Central Alberta 9%
Calgary Region 27%
Southern Alberta 0%
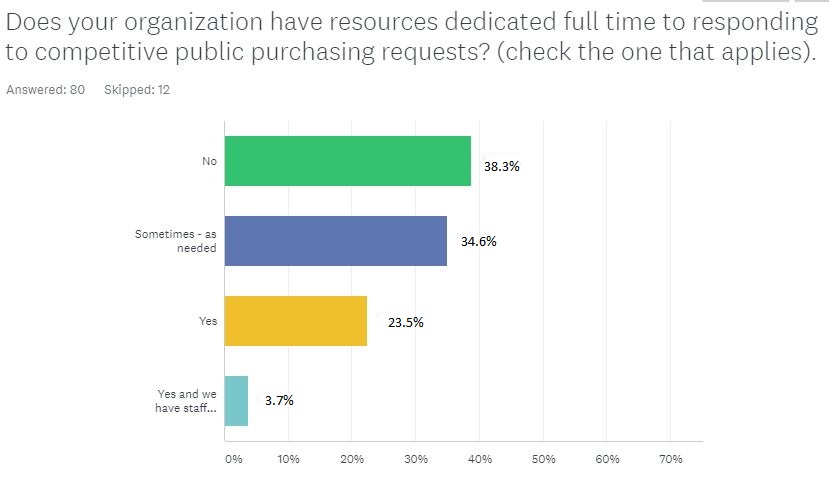
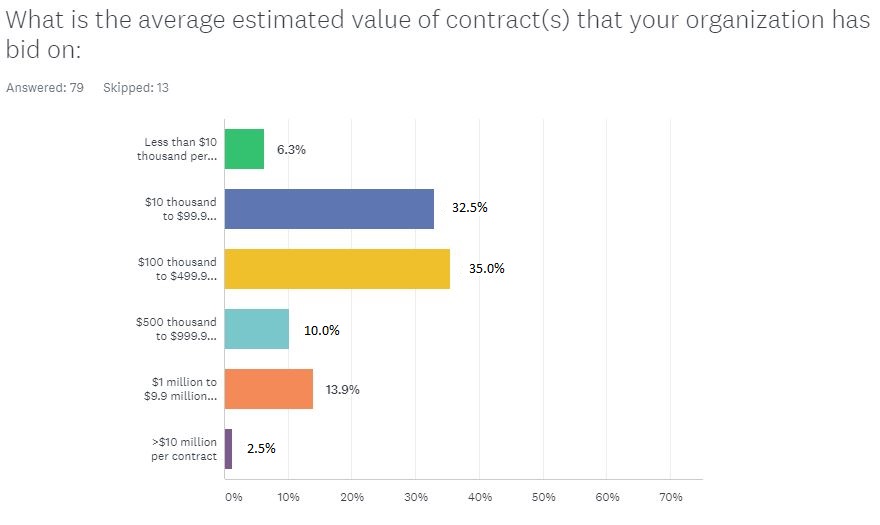
The contractor’s typical contract bid (75%) was $100,000 or less – a small business with 74% having no dedicated resources for responding to
Competitive Provincial (3.8: 5.0) and municipal (3.1: 5.0) procurement purchasing requests.
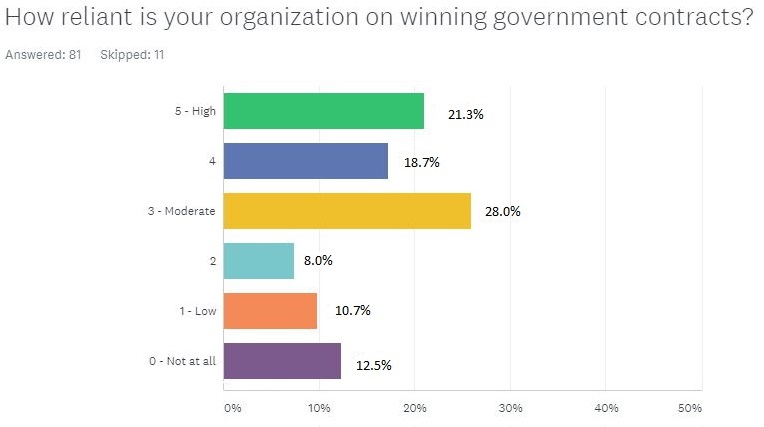
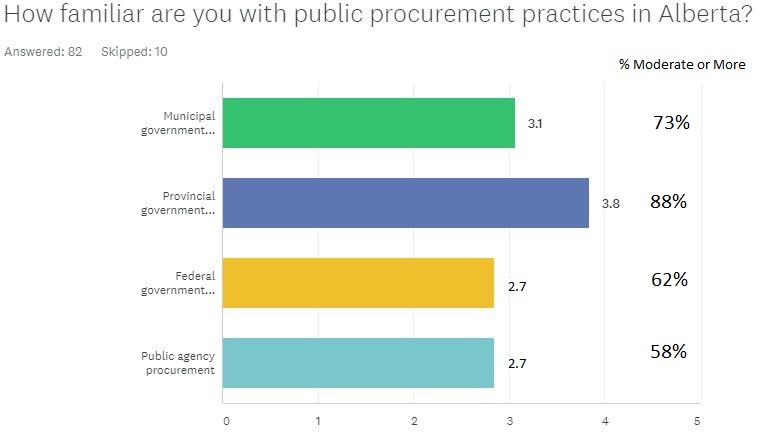
Eighty-eight percent of contractors are moderately or more familiar with provincial procurement practices; they are most familiar with public processes in Alberta. More than 2/3rds of the contractors rely moderately or more on government contracts.
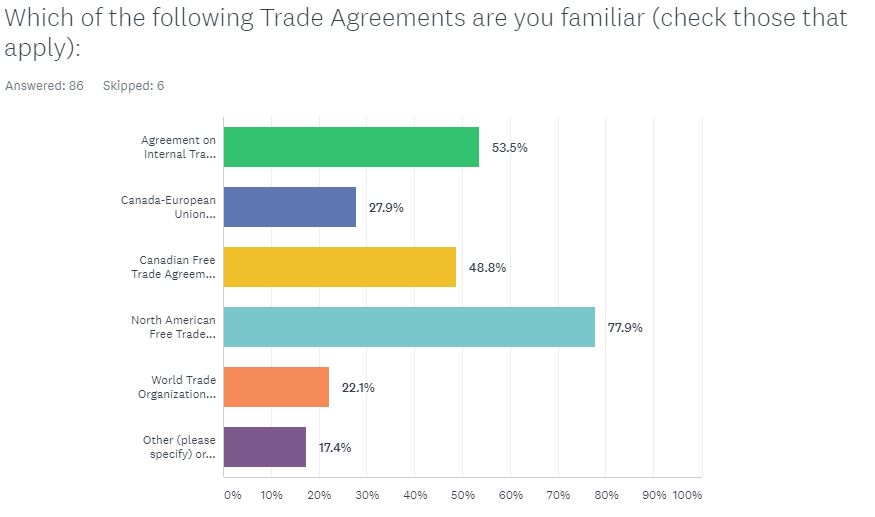
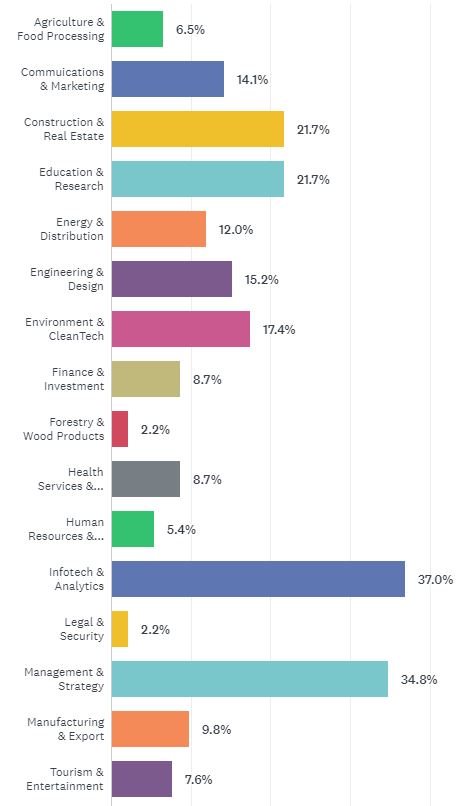
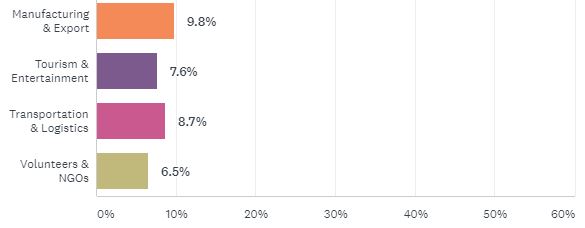

The industries most familiar to contractors engaged in public procurement are: Infotech & Analytics (37%) and Management & Strategy (35%) followed by Construction & Real Estate and Education & Research (both 22%). Familiarity is highest with the North American Free Trade Agreement (77%). Several (10%) also commented on their familiarity with the New West Partnership Trade Agreement.
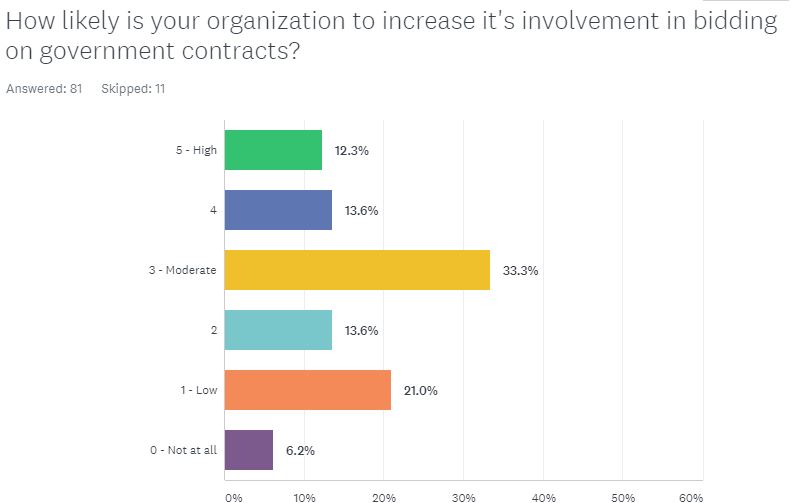
Almost 60% of the contractors expect to increase their involvement in bidding on government contracts.
SUMMARY
The sample includes few administrators and is comprised mainly of public procurement contractors: urban, small-business contractors, that while moderately reliant on provincial bidding up to $100,000, they do not have full-time resources dedicated to public bidding. Most are familiar with information and management services and somewhat less with construction, education and research. Most are familiar with provincial and municipal procurement processes and trade agreements. A majority expect to increase their involvement in bidding on government contracts.
* * *
The next Section B. is comprised of an evaluation of various practice features of public procurement in Alberta from the perspective of contractors.
B. Assessing Alberta’s Public Procurement Practices
For assessing the practice of public procurement in Alberta, we asked respondents to rate their experience with 13 practice features in terms of what is important and expected AND what is received and satisfaction. For discussion, each feature is analyzed and presented independently:
Practice Features – ranked below in order of Expected-Importance (E-I). Ratings are on a 5 point scale from 5 – High to 3 – Moderate to 1 – Low. Gap compares E-I with Received-Satisfaction.
Rating
Gap
Ranking
Delta*
4.37
1.72
4
4.28
1.68
4.5
4.27
1.24
8
4.24
1.68
2.5
4.23
1.86
1
4.20
1.88
3
4.14
1.54
1
4.01
1.25
2
4.00
1.96
7
10. Incentives for innovation, e.g.: technology, partnering, compensation, project management
3.84
2.03
9
11. Clear process for change management
3.84
1.39
2
12. Incentives for economic development e.g.: location, jobs, salary levels
3.36
1.16
–
13. Incentives for social development, e.g. race, gender, education, religion
2.77
0.18
–
Weighted Average
3.97
1.47
*Ranking Delta refers to the difference between a feature’s Expected and Received rank.
Summary. Contractors value most the public procurement features essential to preparing bids, features that are also viewed as having the greatest gaps in what is expected and received. Those features associated with public objectives are viewed as less important though expectations are not being met for innovation.
Contractors differ from one another in a number of ways as identified in section A. In this section we assess the relevance of these characteristics in the contractors assessment of public procurement practices. For example, do contractors differ in their assessment of municipal, provincial and federal public procurement practices or based on where in the province they are located? We start with Location.
LOCATION – Rating of Expected-Importance vs Received-Satisfaction. Ratings are on a 5 point scale from 5 – High to 3 – Moderate to 1 – Low.
Edmonton N=53
Calgary N=16
Other
N=5
Weighted
Average
4.36
4.31
4.80
4.37
4.31
4.06
4.60
4.28
4.36
3.93
4.20
4.27
4.26
4.06
4.40
4.24
4.17
4.33
4.40
4.23
4.09
4.38
4.60
4.20
4.15
3.93
4.40
4.14
4.15
3.50
4.20
4.01
4.06
3.64
4.20
4.00
10. Incentives for innovation, e.g.: technology, partnering, compensation, project management
3.68
4.13
4.40
3.84
11. Clear process for change management
3.79
4.00
3.60
3.84
12. Incentives for economic development e.g.: location, jobs, salary levels
3.23
3.71
3.80
3.36
13. Incentives for social development, e.g. race, gender, education, religion
2.63
1.00
2.40
2.27
Weighted Average
3.94
3.71
4.15
3.93
Observations:
LOCATION – Gaps in Expected-Importance vs Received-Satisfaction. Ratings are on a 5 point scale from 5 – High to 3 – Moderate to 1 – Low.
Edmonton N=53
Calgary N=16
Other N=5
Weighted
Average
1.78
2.40
1.38
1.88
1.55
2.20
1.81
1.68
1.40
0.80
0.87
1.24
1.54
2.20
1.38
1.68
1.81
2.20
1.87
1.86
1.73
2.13
2.40
1.88
1.73
1.00
1.07
1.54
1.33
2.60
0.50
1.35
1.87
2.20
2.00
1.96
10. Incentives for innovation, e.g.: technology, partnering, compensation, project management
1.78
2.60
2.56
2.03
11. Clear process for change management
1.25
1.20
1.86
1.39
12. Incentives for economic development e.g.: location, jobs, salary levels
0.97
1.80
1.57
1.12
13. Incentives for social development, e.g. race, gender, education, religion
0.00
-0.20
1.00
0.18
Average
1.44
1.82
1.54
1.47
Observations:
Summary. Contractors across the three locations are in general agreement that primary public procurement features – those directly impacting bidding, are the most important and also with large gaps between what is expected and received. Large gaps are also cited for most other procurement features including incentives. While incentives are among the least important, they – particularly incentives for innovation, are cited as having a large gap by contractors in all three locations. Inconsistency is apparent between locations in pre-qualifications to bid (Calgary) and in pricing for labour and capital (Edmonton).
Contractors were asked to identify up to three the industries engaged in public procurement that they were familiar. Their rating of each feature was assigned to each industry they identified. Caution, there is considerable variation in the number of observations for each industry
INDUSTRY – Rating of Expected-Importance vs Received-Satisfaction
Public Procurement Practice features
N
1
2
3
4
5
6
7
8
9
10
11
12
13
Weighted
Average
Agriculture & Food Processing
5
4.40
3.00
3.80
3.40
3.40
3.20
3.80
4.20
2.80
3.00
3.20
2.80
3.20
3.40
Communications & Marketing
8
4.38
4.63
4.13
4.50
4.25
3.63
4.13
4.00
4.38
4.00
2.63
3.38
4.50
4.04
Construction & Real Estate
16
4.13
4.31
4.19
4.00
4.27
3.88
4.50
4.33
4.20
3.69
3.27
3.81
3.94
4.04
Education & Research
17
4.06
4.06
3.59
4.29
4.18
3.56
4.19
3.76
4.18
3.65
3.29
3.13
3.63
3.81
Energy & Distribution
11
4.73
4.64
3.55
4.36
4.36
3.70
3.80
3.78
4.40
4.18
3.40
4.33
4.11
4.10
Engineering & Design
9
4.11
4.56
4.22
4.11
4.22
4.11
4.22
4.11
4.11
4.00
2.67
3.33
4.00
3.98
Environment & CleanTech
15
4.33
4.13
3.47
4.07
4.13
3.71
3.93
3.77
4.00
4.00
3.00
3.46
3.69
3.82
Finance & Investment
6
3.67
3.67
3.33
3.17
3.33
2.50
3.33
3.40
3.20
3.50
3.00
3.40
3.00
3.27
Forestry & Wood Products
1
Health & BioTech
7
4.57
4.57
4.29
4.57
4.57
4.00
4.43
4.71
4.43
3.71
2.83
3.71
4.43
4.20
Human Resources & Development
6
3.83
4.33
3.50
4.00
3.83
3.00
3.67
3.50
4.00
3.00
2.56
3.17
3.67
3.56
Infotech & Analytics
27
4.30
4.44
4.19
4.44
4.44
3.89
4.19
4.07
4.44
4.04
4.00
3.44
4.22
4.05
Legal & Security
1
Management & Strategy
26
4.31
4.46
4.19
4.35
4.42
4.15
4.23
4.42
4.62
3.96
2.31
3.19
4.27
4.07
Manufacturing & Export
10
4.40
4.20
4.10
4.10
4.22
4.00
4.30
3.89
4.00
4.30
3.67
4.60
4.60
4.18
Tourism & Entertainment
5
3.80
4.60
4.00
3.80
4.40
3.40
4.20
4.00
4.60
4.00
3.00
3.20
4.60
3.97
Transportation & Logistics
6
4.33
4.33
4.67
4.00
4.33
4.50
4.17
4.50
4.67
4.33
3.00
3.83
4.33
4.23
Volunteers & NGOs
5
3.80
3.40
2.60
3.40
4.00
3.00
3.75
3.40
3.20
2.40
3.20
2.00
2.75
3.15
Weighted Average
4.24
4.28
3.93
4.16
4.23
3.77
4.12
4.05
4.20
3.82
2.90
3.46
4.02
3.94
Observations
INDUSTRY – Gaps in Expected-Importance vs Received-Satisfaction
Public Procurement Practice features
N
1
2
3
4
5
6
7
8
9
10
11
12
13
Weighted
Average
Agriculture & Food Processing
5
1.00
0.00
1.00
0.40
0.40
0.95
1.30
1.00
-0.4
0.80
0.40
-.20
-.30
0.49
Communications & Marketing
8
2.38
2.38
2.13
2.25
2.00
1.50
1.63
1.50
2.13
2.50
-.38
1.63
3.00
1.89
Construction & Real Estate
16
1.77
1.96
1.54
1.57
2.11
1.95
1.71
1.87
1.82
2.12
0.65
1.67
1.72
1.73
Education & Research
17
1.26
1.46
0.85
2.03
1.71
1.63
1.90
1.30
1.64
1.65
0.43
0.84
1.70
1.42
Energy & Distribution
11
2.18
1.91
0.82
1.82
2.00
1.40
1.10
1.00
1.6
2.82
0.80
1.56
1.44
1.57
Engineering & Design
9
2.11
2.27
1.65
1.11
1.65
1.97
0.94
1.54
2.25
2.71
0.38
1.76
2.29
1.74
Environment & CleanTech
15
1.98
1.70
0.90
1.64
1.56
1.56
1.47
0.94
1.23
2.21
0.08
0.71
1.28
1.33
Finance & Investment
6
1.83
1.33
0.33
0.50
1.17
0.67
0.50
1.00
0.60
1.50
0.00
0.80
1.20
0.88
Forestry & Wood Products
1
Health & BioTech
7
2.14
1.57
0.29
1.29
1.14
1.0
1.29
1.57
1.00
2.14
-.43
1.29
1.43
1.21
Human Resources & Development
6
1.50
0.67
0.17
1.50
0.50
0.80
0.67
0.83
0.83
0.50
-.67
0.50
1.33
0.70
Infotech & Analytics
27
2.05
1.80
1.44
1.87
1.87
1.42
1.29
1.68
2.12
2.22
0.23
1.30
2.33
1.66
Legal & Security
1
Management & Strategy
26
1.96
1.69
1.35
1.54
1.54
1.50
1.08
1.69
2.27
2.12
-.08
1.27
2.54
1.57
Manufacturing & Export
10
2.20
1.30
0.60
1.54
0.67
1.70
0.80
0.67
1.00
2.90
0.78
2.40
2.30
1.40
Tourism & Entertainment
5
0.80
2.00
1.80
0.90
1.60
1.20
1.60
1.80
2.00
1.20
0.40
0.80
2.40
1.46
Transportation & Logistics
6
2.50
2.33
2.33
1.53
2.17
2.33
1.50
1.67
2.83
2.67
0.67
1.67
2.33
2.06
Volunteers & NGOs
5
0.40
0.40
-.20
1.40
1.00
0.75
1.25
0.20
0.00
0.20
0.40
-1.0
-.75
0.23
Weighted Average
1.89
1.68
1.13
1.53
1.60
1.47
1.27
1.41
1.69
2.02
0.24
1.21
1.93
1.47
Observations:
Summary. Most public procurement features are viewed as important by all industries surveyed. Variations in importance may reflect objectives specific to the industry, such as the importance attributed to social development in Communications. Gaps also vary considerably between industries with the greatest gaps apparent in Alberta’s infrastructure industries of Transportation and Construction, Engineering and Communications.
Contractors were asked to rate on a scale of from 5 – High to 3 – Moderate to 1 – Low and 0 – None, their familiarity with municipal, provincial and federal public procurement practices in Alberta. The following analyses portray the views of contractors who rated their familiarity as Moderate 3.00 or better with public procurement levels of government and public agencies.
LEVELS of GOVERNMENT AND PUBLIC AGENCIES – Rating of Expected-Importance vs Received-Satisfaction
Municipal
N=59
Provincial N=71
Federal
N=49
Public Agency N=44
Weighted
Average
4.25
4.16
4.36
4.28
4.25
4.43
4.36
4.34
4.53
4.41
4.16
4.01
4.17
4.16
4.12
4.29
4.20
4.34
4.30
4.27
4.33
4.25
4.39
4.33
4.32
3.91
3.85
4.04
3.80
3.90
4.30
4.25
4.46
4.31
4.32
4.26
4.09
4.27
4.17
4.19
4.38
4.22
4.39
4.48
4.35
10. Incentives for innovation, e.g.: technology, partnering, compensation, project management
3.95
3.80
3.91
3.95
3.89
11. Clear process for change management
2.82
2.81
2.87
3.00
2.86
12. Incentives for economic development e.g.: location, jobs, salary levels
3.43
3.35
3.43
2.58
3.43
13. Incentives for social development, e.g. race, gender, education, religion
4.11
3.94
4.00
2.26
4.04
Weighted Average
4.05
3.95
4.08
4.08
4.03
Observations:
LEVELS OF GOVERNMENT and PUBLIC AGENCIES – Gaps in Expected-Importance vs Received-Satisfaction
Municipal
N=59
Provincial N=71
Federal
N=49
Public Agency N=44
Weighted
Average
1.85
1.75
1.93
1.79
1.82
1.79
1.64
1.77
1.83
1.74
1.41
1.17
1.49
1.31
1.33
1.59
1.48
1.75
1.57
1.58
1.63
1.56
1.86
1.84
1.70
1.33
1.37
1.65
1.39
1.42
1.21
1.19
1.50
1.28
1.28
1.57
1.43
1.65
1.61
1.55
2.02
1.81
1.97
2.05
1.95
10. Incentives for innovation, e.g.: technology, partnering, compensation, project management
2.21
1.96
2.21
2.27
2.13
11. Clear process for change management
0.26
0.21
0.38
0.43
0.30
12. Incentives for economic development e.g.: location, jobs, salary levels
1.33
1.11
1.23
1.30
1.23
13. Incentives for social development, e.g. race, gender, education, religion
2.13
1.86
1.79
2.04
1.95
Weighted Average
1.56
1.43
1.63
1.59
1.54
Observations:
Summary. Contractors have a consistent view of what is important- expected as practiced by several levels of government and public agencies, namely the primary practice features. Similarly, while large, gaps are consistent though gaps are apparent in incentives for innovation and social development. Where objectives may differ – such as public agencies compared with levels of government, gaps are less apparent in what is expected and received.
In the following analysis we assembled the profile of the organizations that are most and least likely to increase their involvement in bidding on government contracts employing a scale of 5 – High, 3- Moderate, 1 – Low, 0 – Not at all. All proportions are weighted. The section concludes with a sample of comments from each group.
PROFILE –
INCREASING INVOLVEMENT IN BIDDING
HIGH – >3
LOW – <3 including
0 – Not at all
MODERATE – 3
OVERALL
27%
40%
33%
Declining interest 40% of contractors in public procurement compares with 60% moderate and expecting to increase.
LOCATION
% Edmonton Region
% Calgary Region
% Other
24%
38%
36%
18%
53%
35%
83%
17%
0%
The interest of public procurement contractors in Calgary may be declining with the proportion outside Edmonton and Calgary increasing.
RELIANCE
High – 40%
67%
24%
36%
Moderate – 28%
10%
55%
24%
Low – 32%
24%
21%
40%
Contractors expecting to increase their involvement in public procurement bidding (67%) are also the more reliant on winning bids (40%). Most expecting to decrease their involvement (55%) have a moderate reliance (28%). Those least likely to change – increase or decrease their involvement (40%) are among the least reliant (32%).
INDUSTRY
The top four industries familiar to public procurement contractors
Construction
Management
Infotech
Infotech
Communications
Management
Education
Infotech
Communications
Manufacturing
Construction
Manufacturing
Interest in bidding among contractors familiar with Manufacturing may be increasing; uncertainty is indicated among those familiar with Infotech and Construction. Decreasing interest is apparent with those familiar with Management and Communications.
GOVERNMENT familiarity > Moderate
% Municipal
45%
41%
41%
% Provincial
68%
77%
70%
% Federal
32%
40%
37%
% Public Agency
50%
41%
41%
Familiarity with public procurement practices is highest with the Provincial government for all three groups. Familiarity between groups is quite consistent, with a maximum of 9% between High and Low for contractors familiar with Provincial government and Public Agency procurement.
TRADE Agreements familiarity
NAFTA – 73%
64%
78%
74%
AIT – 48%
64%
34%
52%
CFTA – 44%
55%
38%
44%
CETA – 26%
23%
28%
26%
WTO-GDP – 21%
18%
34%
7%
Contractors with decreasing interest in public procurement are more than twice as familiar with the NAFTA trade agreement than with any other agreement and are more familiar than others with the WTO-GDP agreement. Uncertainty in current NAFTA negotiations may have a bearing on contractor expectations.
STAFF
No
18%
56%
33%
Sometimes – as needed
41%
19%
48%
Yes
32%
22%
19%
Yes – dedicated
9%
3%
0%
Few contractors have staff dedicated to public procurement. Contractors responding to the survey are likely small. The contractors with increasing interest in public procurement have staff either dedicated or available. Those least likely are among those with no procurement staff.
BIDDING
Less than $10 thousand to $99.9K
23%
41%
50%
$100 thousand to $499.9 thousand
36%
32%
35%
$500 thousand or more
41%
26%
16%
Interest in increasing involvement in bidding is highest among the larger bidders and low to moderate among the smaller bidding.
The following comments provide additional insight as to contractor’s expectations and concerns:
Decreasing interest
Moderate interest
Increasing interest
Summary. The contractor profile helps explain why 40% of the survey contractors indicated a decreasing interest in bidding on public contracts particularly among the Calgary Region’s small businesses contractors lacking procurement resources in construction, infotech and management services. The moderate and declining interest among larger contractors may be associated with uncertainties surrounding current inter-provincial and international trade negotiations. Comments provide some insight into the procurement processes of concern including reference to perceived bias and waste.
* * *
The next Section C. is comprised of an evaluation of the various objectives of public procurement in Alberta from the perspective of both the administrators and contractors.
C. Assessing Alberta’s Public Procurement Objectives
For assessing the objectives of public procurement in Alberta, we asked respondent to rate their level of agreement with 9 objectives. Note, the objectives are each stated in positive terms. For discussion, each objective is analyzed and presented independently.
Public Procurement Objectives – Ratings on a scale from 5 – Agree to 3 – Neither, to 1 – Disagree. Listed in order of the declining gap – the alignment between the two groups.
Administrators
N=11
Contractors
N=81
Gap
Disaster Recovery. Disaster recovery planning should give priority to pre-qualifying of local suppliers.
3.09
3.16
-0.07
Economic development. Setting economic expectations (e.g.: jobs, location, salary levels) within the terms of procurement is appropriate for economic development.
3.00
2.89
0.11
Social development. Setting social expectations (e.g.: gender, race, education, religion) within the terms of procurement is appropriate for social development.
2.82
2.66
0.16
Transparency. Government purchasing is transparent, fair and free from conflict of interest.
2.64
2.20
0.44
Value for Money. Public procurement practices are effective for obtaining best economic value in the purchase of supplies and services.
2.45
1.95
0.51
OVERALL. Alberta government procurement practices are free from waste, fraud, and corruption.
2.73
2.20
0.53
Vision & Leadership. Procurement practices are aligned with the vision and values of the government.
3.18
2.43
0.75
Effectiveness. Government procurement and project management are well aligned. That is, deliverables are on-time, on-budget, and as specified.
2.91
2.10
0.81
Innovation. Rewarding creative options (e.g.: technology, partnering, project planning, compensation) within the terms of procurement is appropriate for stirring innovation.
4.09
2.56
1.53
Weighted Average
2.99
2.46
0.53
Observations
Summary
Administrators and Contractors both disagree with most of the stated positive objectives of public procurement. The only exception is Disaster Recovery, for which both agree and rated highest. Each objective warrants some discussion particularly Value for Money that is rated lowest by both groups. Administrators rate more highly than Contractors the government’s objectives of Innovation, Vision and Leadership, and Effectiveness. Of concern is the generally low ratings for both Administrators and Contractors for the prime objectives of public procurement: Value for Money, Transparency, and OVERALL.
Public Procurement Objectives – Ratings on a scale from 5 – Agree to 3 – Neither, to 1 – Disagree. Listed in descending order of the objectives weighted average rating.
Edmonton
Region N=53
Calgary
Region N=16
Other
N=5
Weighted Average
1. Disaster Recovery. Disaster recovery planning should give priority to pre-qualifying of local suppliers.
3.16
3.18
3.20
3.16
2. Economic development. Setting economic expectations (e.g.: jobs, location, salary levels) within the terms of procurement is appropriate for economic development.
3.02
2.89
1.40
2.89
3. Social development. Setting social expectations (e.g.: gender, race, education, religion) within the terms of procurement is appropriate for social development.
2.68
2.44
3.20
2.66
4. Innovation. Rewarding creative options (e.g.: technology, partnering, project planning, compensation) within the terms of procurement is appropriate for stirring innovation.
2.67
2.50
1.60
2.56
5. Vision & Leadership. Procurement practices are aligned with the vision and values of the government.
2.47
2.29
2.40
2.41
6. Transparency. Government purchasing is transparent, fair and free from conflict of interest.
2.33
1.89
1.80
2.20
7. OVERALL. Alberta government procurement practices are free from waste, fraud, and corruption.
2.19
2.28
2.00
2.20
8. Effectiveness. Government procurement and project management are well aligned. That is, deliverables are on-time, on-budget, and as specified.
2.00
2.22
2.80
2.10
9. Value for Money. Public procurement practices are effective for obtaining best economic value in the purchase of supplies and services.
1.96
1.94
1.80
1.95
Weighted Average
2.50
2.40
2.24
2.46
Observations
b) INDUSTRY. Contractors regardless of what industry they are familiar align in their agreement with support for the Disaster Recovery objective – with the exception of Finance and Construction, and disagreement with most of the other stated public procurement objectives particularly Value for Money
INDUSTRY
Public Procurement Objectives
Listed as per the previous table above
Rating on a scale of 5 – Agree to 3 – Neither, to 1 – Disagree
N
1
2
3
4
5
6
7
8
9
Weighted
Average
Agriculture & Food Processing
5
3.60
3.40
3.20
2.60
3.80
2.40
2.20
2.40
2.40
2.89
Communications & Marketing
9
2.78
3.22
3.00
2.33
2.75
1.44
1.89
1.78
2.11
2.36
Construction & Real Estate
17
2.71
2.47
2.12
2.41
2.00
2.12
1.88
2.00
1.47
2.13
Education & Research
17
3.18
2.82
2.82
2.18
2.47
2.53
2.29
2.24
1.94
2.50
Energy & Distribution
11
3.80
3.55
2.91
2.67
2.45
2.55
2.56
2.55
2.00
2.73
Engineering & Design
9
3.22
2.78
2.78
2.67
2.33
2.33
2.56
2.22
1.67
2.51
Environment & CleanTech
15
3.43
2.73
2.80
2.00
2.87
2.80
2.87
2.73
2.33
2.72
Finance & Investment
6
2.33
2.86
2.71
2.57
3.00
2.29
2.43
2.29
2.00
2.51
Forestry & Wood Products*
1
Health & BioTech
7
3.13
3.88
2.38
1.88
2.75
2.25
1.88
1.75
2.00
2.43
Human Resources & Development
6
3.17
3.50
3.00
3.33
3.17
3.33
2.83
2.17
2.00
2.94
Infotech & Analytics
29
2.93
2.48
2.52
2.28
2.10
2.14
2.00
1.86
1.79
2.23
Legal & Security*
2
Management & Strategy
27
3.11
2.81
2.52
2.56
2.37
2.44
2.41
2.33
2.22
2.53
Manufacturing & Export
11
3.55
3.18
2.55
2.27
1.82
2.00
1.91
1.73
1.45
2.27
Tourism & Entertainment
6
3.00
3.17
3.17
3.00
3.00
2.50
2.33
2.17
2.17
2.72
Transportation & Logistics
6
3.83
2.00
2.83
1.83
2.50
2.17
2.50
2.33
2.00
2.44
Volunteers & NGOs
6
3.00
3.17
2.83
2.17
3.33
2.67
2.50
2.50
2.00
2.69
Weighted Average
3.13
2.89
2.67
2.35
2.49
2.34
2.29
2.17
1.95
2.47
*Sample size too small to consider including in analysis.
Observations
Contractors rating familiarity >2
Public Procurement Objectives – Ratings on a scale from 5 – High to 3 – Moderate, to 1 – Low. Listed in descending order of the objectives weighted average rating.
Municipal
N=59
Provincial
N=71
Federal
N=49
Public Agency
N=44
Weighted Average
1. Disaster Recovery. Disaster recovery planning should give priority to pre-qualifying of local suppliers.
3.14
3.37
3.10
3.23
3.22
2. Economic development. Setting economic expectations (e.g.: jobs, location, salary levels) within the terms of procurement is appropriate for economic development.
2.73
2.96
2.69
2.98
2.84
3. Social development. Setting social expectations (e.g.: gender, race, education, religion) within the terms of procurement is appropriate for social development.
2.76
2.85
2.57
2.73
2.74
4. Innovation. Rewarding creative options (e.g.: technology, partnering, project planning, compensation) within the terms of procurement is appropriate for stirring innovation.
2.37
2.62
2.35
2.48
2.46
5. Vision & Leadership. Procurement practices are aligned with the vision and values of the government.
2.26
2.51
2.27
2.53
2.39
6. Transparency. Government purchasing is transparent, fair and free from conflict of interest.
2.22
2.37
2.29
2.18
2.27
7. OVERALL. Alberta government procurement practices are free from waste, fraud, and corruption.
2.19
2.37
2.18
2.36
2.28
8. Effectiveness. Government procurement and project management are well aligned. That is, deliverables are on-time, on-budget, and as specified.
2.15
2.22
2.04
2.20
2.16
9. Value for Money. Public procurement practices are effective for obtaining best economic value in the purchase of supplies and services.
1.86
2.06
1.92
1.95
1.95
Weighted Average
2.41
2.45
2.38
2.52
2.48
Observations
In the following analysis we assembled the profile of the Contractors that agree and disagree most with the two prime public procurement objectives: VALUE FOR MONEY and TRANSPARENCY. The difference between the two is considered “uncertainty” – neither agree or disagree.
CONTRACTOR PROFILE –
AGREE (5 and 4) AND DISAGREE (1 and 2)
Transparency. Government purchasing is transparent, fair and free from conflict of interest.
Value for Money. Public procurement practices are effective for obtaining best economic value in the purchase
of supplies and services.
AGREE
DISAGREE
AGREE
DISAGREE
OVERALL – weighted average rating of all Contractors
21%
63%
8%
68%
About 2/3rds of the Contractors disagree with both the Transparency and Value for Money objectives. Fewer Contractors agree with the Value for Money objective than for the Transparency objective.
LOCATION – weighted average rating of all Contractors
% Edmonton Region N=57
23%
58%
8%
65%
% Calgary Region N=18
17%
72%
11%
72%
% Other N= 5
20%
80%
0%
80%
Contractors in each of the Regions align with less agreement with the stated Value for Money objective than Transparency. Disagreement with the Transparency objective is least for the Edmonton Region.
RELIANCE – on winning bids. Contractors weighted average rating
High – 40%
22%
48%
9%
73%
Moderate – 28%
30%
63%
7%
56%
Low – 32%
13%
73%
10%
74%
Contractors with the highest and the lowest Reliance on winning bids have the greatest disagreement with the stated Value for Money objective. A large 37% of those with a Moderate Reliance Neither Agree or Disagree with the Value for Money objective and 30% with a High Reliance neither agree or Disagree with the Transparency objective..
INDUSTRY – familiarity
The top four industries with the highest
ratings by contractors familiar with public procurement
Human Resources – 63%
Communications – 89%
Tourism – 33%
Construction – 82%
Health – 38%
Transportation – 67%
Volunteers – 33%
Manufacturing – 82%
Management – 37%
Infotech – 66%
Human Resources – 25%
Engineering – 78%
Environment – 33%
Health – 63%
Agriculture – 20%
Infotech – 75%
Contractors familiar with procurement in all industries disagree with the Value for Money objective – particularly Construction and Manufacturing, and somewhat less for Transparency with Communications strongly disagreeing. Other than Human Resources for Transparency with 63% agreeing, no industry agreed more than 33% with the Value for Money or 38% with the Transparency objectives.
GOVERNMENT – familiarity
% Municipal
22%
61%
5%
72%
% Provincial
23%
62%
8%
69%
% Federal
24%
57%
8%
69%
% Public Agency
20%
61%
2%
66%
Regardless of familiarity with the levels of government, most disagree and few agree with the Transparency and Value for Money objectives. The proportion of Contractors agreeing with the Value for Money objective is considerably lower than the – also low, proportion agreeing with the Transparency objective.
TRADE Agreements – familiarity
NAFTA – 73% of Contractors
22%
59%
9%
66%
AIT – 48% of Contractors
31%
49%
8%
72%
CFTA -44% of Contractors
22%
61%
6%
75%
CETA – 26% of Contractors
19%
67%
10%
67%
WTO-GDP – 21% of Contractors
25%
56%
13%
63%
Regardless of familiarity with various trade agreements, most disagree and few agree with the Transparency and Value for Money objectives.
STAFF – procurement
No
23%
67%
10%
66%
Sometimes – as needed
23%
53%
7%
62%
Yes – including dedicated
10%
47%
3%
59%
Regardless of whether staff are available for bidding, most disagree and few agree with the Transparency and Value for Money objectives. Contractors with procurement staff – likely the larger organizations, agree less than those without procurement staff with the objectives of both Transparency and Value for Money. Uncertainty – the proportion neither agreeing or disagreeing, is generally higher for the larger organizations.
BIDDING – increasing?
High – 28%
13%
74%
10%
74%
Moderate – 34%
30%
63%
4%
58%
Low including no – 39%
23%
45%
9%
73%
Regardless of expectations on increasing/decreasing bidding, most disagree and few agree with the Transparency and Value for Money objectives. The proportion of Contractors with a Low to Moderate expectations to increase their bidding agree more with the Transparency objective than the Value for Money objective. Uncertainty is greatest for those with Low expectations (32%) for the Transparency objective. Whereas Uncertainty is greatest for those with Moderate expectations (38%) for the Value for Money objective.
BIDDING – average value
Less than $10 thousand to $99.9K
32%
65%
13%
53%
$100 thousand to $499.9 thousand
26%
56%
7%
70%
$500 thousand or more
0%
67%
0%
86%
Regardless of a Contractor’s average Bidding value, most disagree/ few agree with the Transparency and Value for Money objectives. The larger the average bidding value, the lower the agreement with both objectives of Transparency and Value for Money, and the higher the disagreement for Value for Money.
The following comments provide additional insight as to contractor’s expectations and concerns with the public procurement objectives:
CONTRACTOR’S COMMENTS RE: THE OBJECTIVES
ADMINISTRATOR’S COMMENTS RE: THE OBJECTIVES
Summary. Contractors and Administrators disagree with the stated positive objectives of public procurement. The Disaster Recovery objective is the only exception. Otherwise, Administrators rate high – higher than Contractors, government’s stated objectives of Innovation and Vision & Leadership, and Effectiveness. Surprising is the low rating Contractors have – considerably lower than Administrators, for the objective of Effectiveness. Government procurement and project management are well aligned. That is, deliverables are on-time, on-budget, and as specified.
Otherwise, while rated higher than Contractors, Administrators support is weak for the other objectives – particularly Value for Money – that both rate lowest. Of concern must be the generally low ratings by both Administrators and Contractors for the prime objectives of public procurement: Value for Money, Transparency, and OVERALL.
The low agreement and very high disagreement by Contractors with all objectives – other than Disaster Recovery, is consistent for most Contractor features with the possible exception of size. The disregard for the objectives of Value for Money and Transparency is highest for larger organizations.
The comments reviewed indicate that the prime issues are with waste not corruption or fraud.
* * *
The next Section D. Recommendations and Conclusion, contains a summary of the survey respondent’s recommendations and an overall conclusion.
D. Recommendations and the Conclusion
This – the concluding Section of the survey, identifies the respondent’s recommendations. They are presented in clusters associated with the primary issues identified in the prior Sections re procurement practices and objectives. Note. The bullets that appear below after each recommendation are the direct quotes as received by respondents with minor edits to fix spelling, punctuation, and evident grammatical errors. Where corporations were identified, their names have been deleted.
With the exception of the objective of Disaster Recovery, both Administrators and Contractors agree that the objectives of public procurement are not being met and that there are serious flaws in public procurement practices. These perspectives are quite consistent for all Contractors.
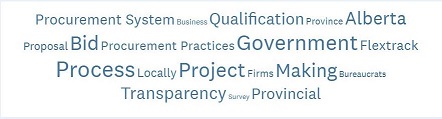
The following Section D presents the recommendations of the Contractor’s and the Administrator’s for improving public procurement. The following word cluster highlights the overall concerns and associated recommendations. Each are then presented and discussed independently.
3. Value for Money requires a commitment to Innovation.
Throughout the survey reference is made to the merit of innovation in advancing the economy and adding value. Innovation is central to government’s objective of providing Vision and Leadership. Yet, Contractors view Innovation as compromised in the practice and objectives of public procurement.
Comments frequently reference “waste” as the basis for the very low support for this objective. While several recommendations can be cited to redress the shortfall, most evident is the merit of innovation.
4. Ensuring Transparency requires unbiased oversight. A periodic external review is needed for addressing the distrust and suspected favouritism, bias, and waste acknowledged by Contractors and Administrators.
5. Minor changes to public procurement practices should be considered to improve overall efficiency. Several practices core to obtaining Value for Money are identified as in need of review and removing inefficiencies contributing to waste and distrust. Heavy weighting on price is frequently mentioned and Flextrack is identified as an experiment gone wrong.
6. Modernize Alberta’s Public Procurement. Is public procurement broken? That $Bs are being wasted particularly in construction and infotech is acknowledged – and public. The level of non-support for public procurement throughout the survey and frustration among contractors is palatable. Several recommendations hint at the value of learning from others and collaborating for modernizing public procurement in Alberta.
7. Nothing to add – though frustration is apparent. The following comments were received in the request for recommendations, but are not constructive:
During the survey we were criticized for the broad distribution of the survey and the survey’s leadin title “Is Alberta’s Public Procurement Broken?
Conclusion. The survey was designed to obtain an independent view of public procurement in Alberta. It was triggered by reports of waste and repeated complaints about public procurement bias received by ABCtech. The objective has been met and the results too obvious and significant to ignore. What is not so obvious is how to re-establish trust among the various stakeholders in the system. Of the array of recommendations cited above, these would appear to be the more reasonable for starters:
Public procurement spends $Billions annually and is fundamental to public services throughout the province. It is viewed with distrust and needs fixing. There will be those who rely on the status quo, who will resist reform. However, with the shared objectives of Value for Money and Transparency and Effectiveness including a high regard for Alberta enterprise and innovation, the proposed recommendations should be widely accepted.